
how to check cpu temperature windows 11 is one of those tasks you usually ignore, until your laptop fan won’t calm down, games start stuttering, or the PC randomly shuts off.
The tricky part is Windows 11 doesn’t make CPU temperature obvious in a single, always-visible place, so people guess based on fan noise or case heat, and that’s often misleading. A modern CPU can run warm under load and still be fine, while a cooler-feeling system can still be throttling.
This guide walks you through practical ways to read CPU temps on Windows 11, how to interpret what you see, and what to do if temperatures look suspicious, without turning it into a hardware engineering project.
Why CPU temperature matters (and what’s normal-ish)
CPU temperature matters because it directly affects performance and stability. When a processor gets too hot, it may throttle, meaning it automatically slows down to protect itself. In some cases, the system can crash or shut down to avoid damage.
What counts as “normal” depends on your CPU model, cooler, laptop chassis, room temperature, and workload. But in many everyday setups, you’ll often see:
- Idle / light use: roughly 30–50°C (can be higher on thin laptops)
- Gaming / heavy apps: often 60–85°C
- Short spikes: brief jumps can happen when boosting
Key point: Don’t panic over a single peak. Look at sustained temps under the same workload, plus symptoms like throttling, loud fans, or crashes.
Quick self-check: do you actually need to measure it?
If your PC feels normal, you may only need a quick check once in a while. If any of these show up, checking temperatures becomes more than curiosity.
- Fans run hard during simple tasks (browser, email)
- FPS drops over time, then recovers after a break
- Random restarts, shutdowns, or blue screens under load
- CPU usage looks modest, but the system still feels sluggish
- Recently changed a cooler, applied thermal paste, or cleaned the PC
If you’re troubleshooting a stability problem, measure CPU temp while reproducing the issue, not just at idle.
Method 1: Check CPU temperature in BIOS/UEFI (built-in, but limited)
If you want a baseline without installing anything, you can read CPU temperature in BIOS/UEFI. The catch: it’s not a real-world Windows workload reading, it’s more like a “garage idle” measurement.
How to get there
- Settings → System → Recovery → Advanced startup → Restart now
- Troubleshoot → Advanced options → UEFI Firmware Settings
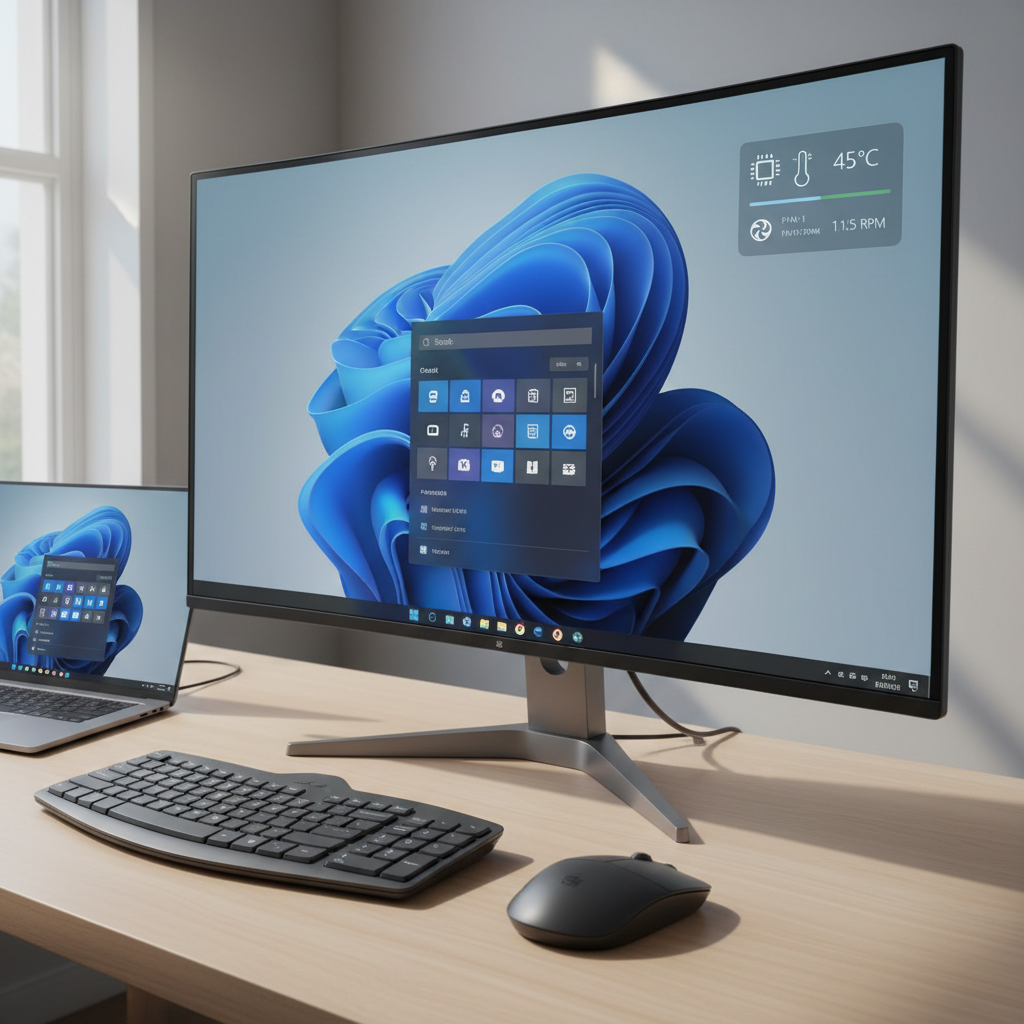
Look for Hardware Monitor, PC Health, or similar. You may see CPU temperature and fan RPM.
When this helps: confirming your cooler is at least functioning, or seeing if idle temps are wildly high right after a build.
Method 2: Use your motherboard vendor utility (common on desktops)
For many desktop PCs, the easiest path is the motherboard vendor’s own Windows utility, because it reads the correct sensors and may show fan curves too. This varies by brand, and the interface changes often, so the goal is simple: find the temperature readout and confirm it updates under load.
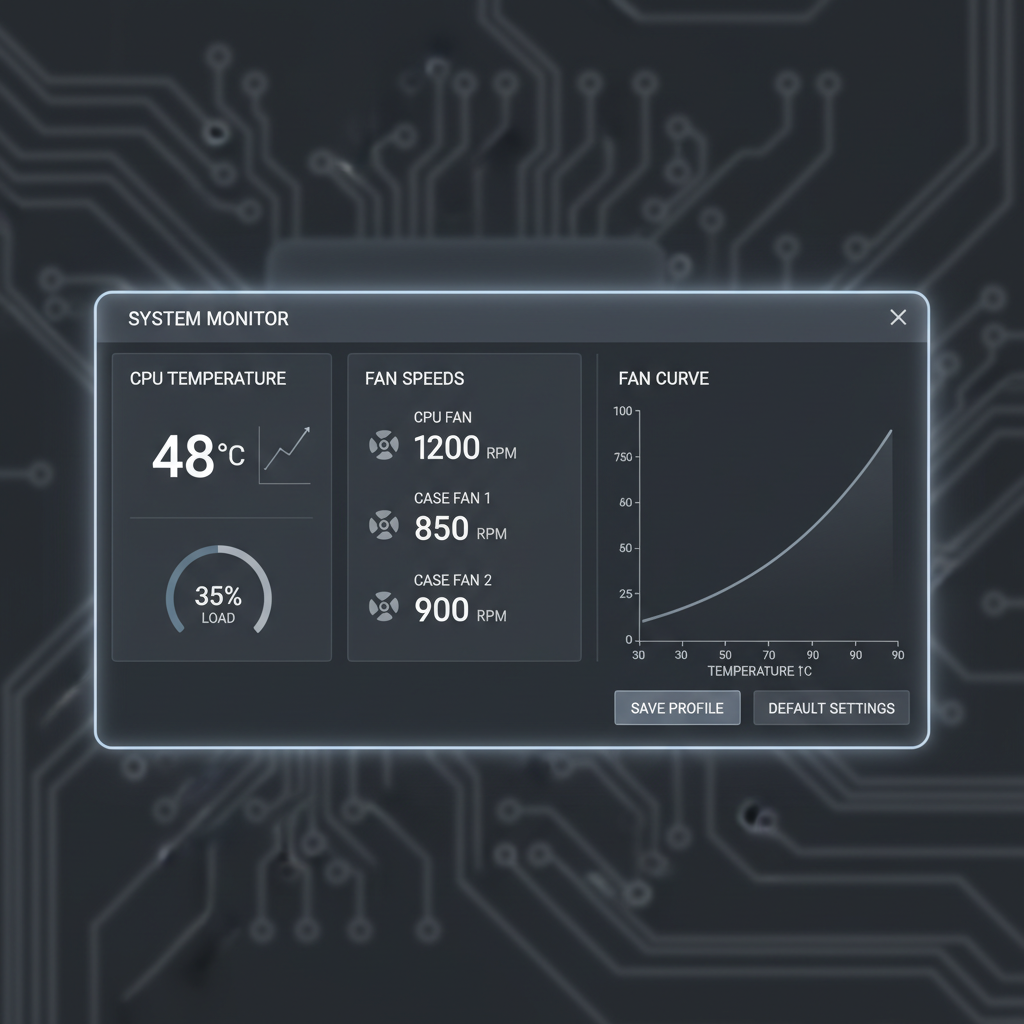
Tip: If the app shows multiple CPU-related readings (CPU, CPU Package, Tctl/Tdie), use the one labeled Package or the vendor’s primary CPU temp. It’s usually the best “overall” number for quick decisions.
Reality check: Vendor tools can be heavier than you want, and some people uninstall them after troubleshooting. That’s fine; just avoid stacking multiple monitor tools that poll sensors at the same time.
Method 3: Use a trusted third-party monitor (best for most people)
If you want a straightforward answer to how to check cpu temperature windows 11 while you game, render, or run tests, third-party tools are usually the most practical option. They can show current temp, minimum/maximum, and per-core values.
Two common approaches:
- Lightweight monitoring: a simple sensor readout you can keep open on a second monitor
- Overlay monitoring: temperatures displayed on top of games (helpful for FPS drops)
Pick one tool and stick with it during testing. When multiple apps read sensors at once, you can get odd readings or unnecessary background load.
Safety note: Download utilities from the developer or reputable sources, and avoid “free PC optimizer” bundles that add popups or background services.
What to look for: a practical temperature interpretation table
Instead of chasing a universal magic number, use this table as a decision guide. Your CPU’s designed limits can differ, and laptops often run hotter by design.
| What you see under load | What it often means | What to do next |
|---|---|---|
| Under ~80°C and stable | Likely normal for many setups | Log max temp, move on |
| 80–90°C sustained | Warm; may be fine, may throttle depending on CPU/cooling | Check airflow, fan curves, dust, background load |
| 90–100°C sustained | Often near limits; throttling is common | Reduce load, inspect cooler mounting, consider repaste/undervolt (advanced) |
| Sudden spikes + shutdowns | Cooling failure, power issue, or unstable config | Stop stress tests, inspect hardware, consider professional help |
According to Intel, modern processors include thermal protection features that reduce performance as temperatures approach maximum limits. According to AMD, Ryzen processors also manage boost and thermals dynamically, so short spikes can be expected in some workloads.
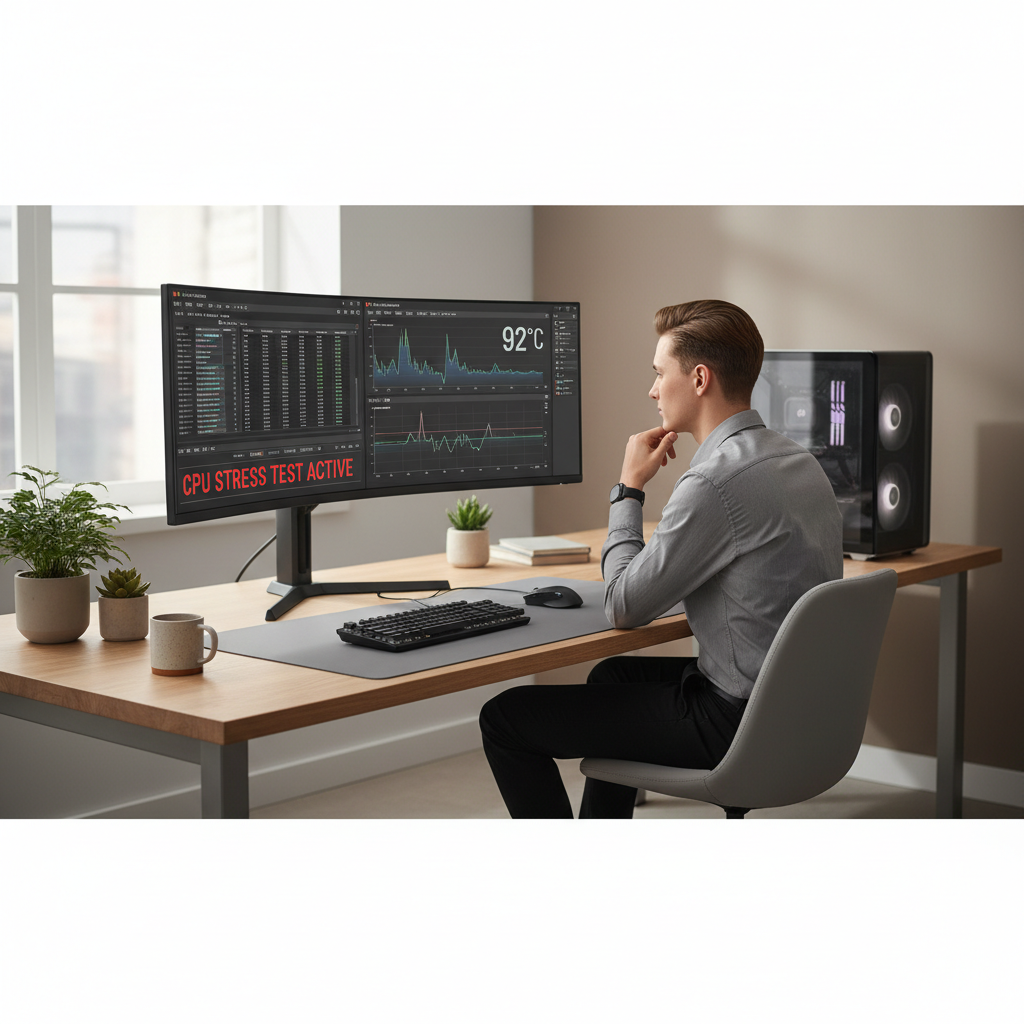
Hands-on workflow: measure correctly (without fooling yourself)
This is the part most guides skip, and it’s where people get stuck. To check temperatures in a way that actually answers “Is this a problem?”, you need a repeatable mini-test.
- Step 1: Close heavy background apps (extra browsers, launchers, updaters) so the test reflects your real issue.
- Step 2: Open one monitoring tool and note idle temp after 5 minutes.
- Step 3: Recreate your workload for 10–15 minutes (game, export, compile). Watch current and max temperature.
- Step 4: If performance drops, check if CPU clocks fall at the same time. That pattern often suggests throttling.
- Step 5: Write down: ambient room feel, workload, max temp, whether fans hit max.
If you only check for 30 seconds, you may miss heat soak, where the whole cooling system gradually saturates and temps climb later.
Fixes that usually help (from easiest to more involved)
If your readings look high, don’t jump straight to replacing parts. Most improvements come from boring basics, and yes, they work.
Low-effort wins
- Clean dust filters and heatsinks: clogged fins can raise temps fast, especially in pets-and-carpet homes.
- Improve airflow: front intake unobstructed, rear/top exhaust working, cables not blocking fans.
- Check power plan: Balanced is usually fine; extreme performance modes can increase heat for little gain.
- Update BIOS and chipset drivers: sometimes improves fan control and boosting behavior, though results vary.
Mid-effort fixes (common on desktops)
- Reseat the cooler: uneven mounting pressure can cause one core to run hot.
- Reapply thermal paste: helpful if paste is old, poorly applied, or the cooler was bumped.
- Adjust fan curves: slightly more aggressive ramp can prevent heat soak.
Advanced options (use caution)
- Undervolting: can lower temps without much performance loss, but stability testing matters and some systems limit it.
- Reduce power limits: a practical way to trade a small performance drop for a big noise/temperature improvement.
If you’re on a laptop, airflow and power limits often matter more than repasting, unless the machine is older or has clearly degraded paste. Some thin laptops simply run hot under load by design.
Common mistakes (the stuff that wastes time)
- Comparing your temps to someone else’s screenshot: different CPU, cooler, room temp, case, even silicon variation.
- Assuming Task Manager shows CPU temperature: Windows 11 Task Manager typically doesn’t provide it.
- Reading the wrong sensor: motherboard “CPU” vs “Package” can differ; pick the consistent one.
- Fixating on idle: load temps tell you more about throttling and stability.
- Stacking multiple monitor apps: more charts do not mean better insight.
When to stop DIY and get help
If you see sustained temps near the top of the table and the PC shuts down, or if you suspect a failing fan/pump, consider getting a qualified technician involved. Water coolers can fail in ways that look like “random heat,” and power delivery issues can mimic thermal problems.
Also, if the system is under warranty, opening it or repasting might affect coverage in some cases, so it’s worth checking your manufacturer terms before you start.
Key takeaways (so you can act today)
- Use one monitoring method and test under a repeatable workload, not just idle.
- Look for sustained heat and throttling, not a single spike.
- Start with cleaning and airflow before buying new parts.
- Escalate to reseating/repasting if temps stay high and symptoms persist.
If you want the simplest next step, pick one monitoring tool, run your usual heavy task for 10–15 minutes, and log the max temp. That single note often tells you whether you’re dealing with normal behavior or a cooling problem worth fixing.